Tiles Option
How to use the tiles option?
-
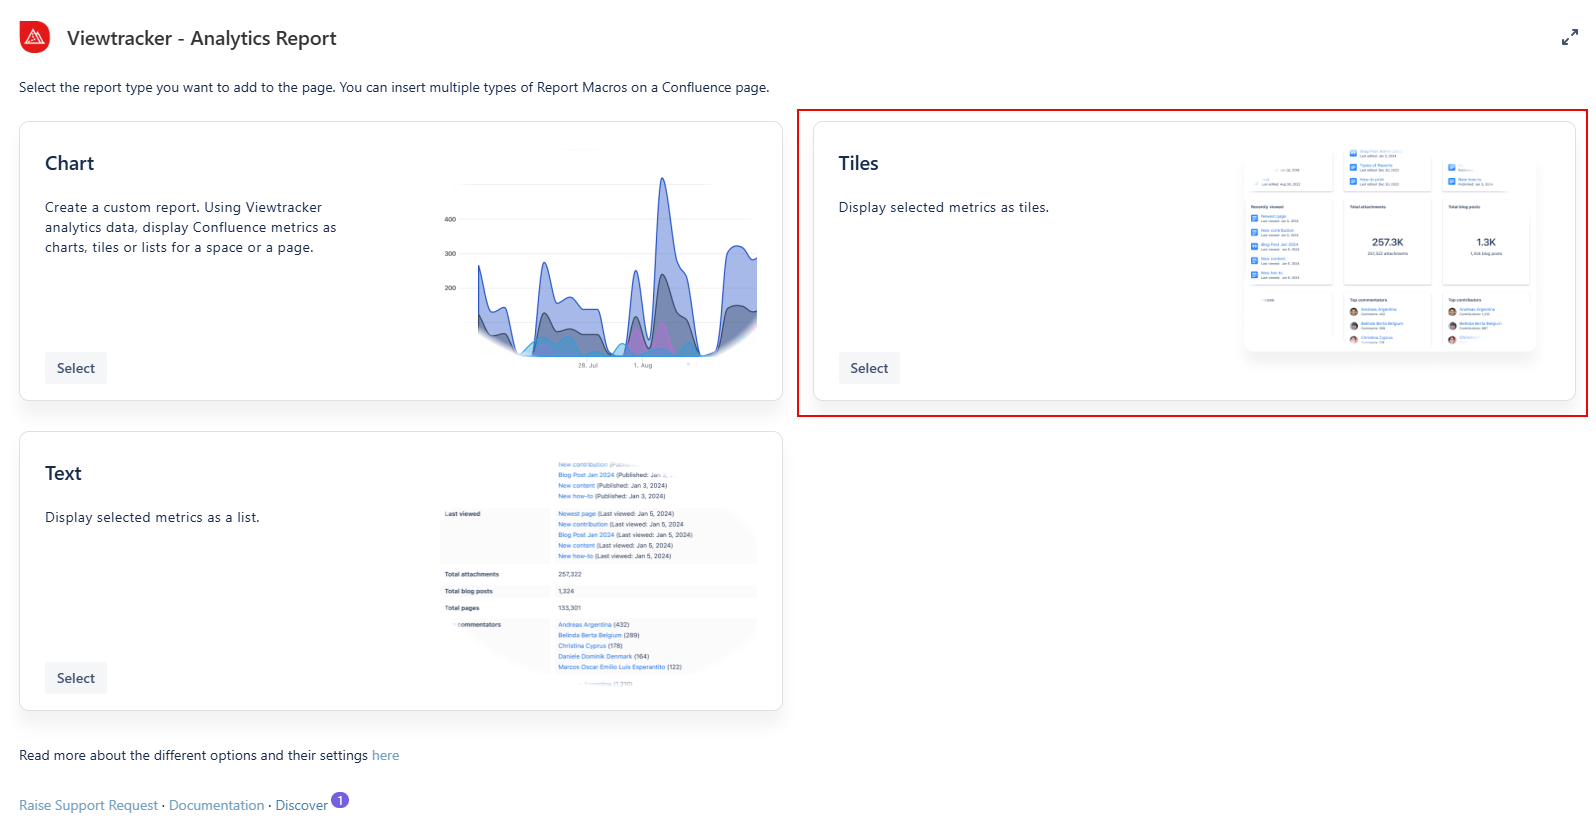
Insert the Analytics Report macro on a page.
-
Click “Tiles” within the Analytics Report.
-
In the field “Content,” you can select between a space or a page.
-
You can type in the specific name of the space or page.
-
-
Adapt the general settings (see options below).
-
Use the preview to check if everything looks as expected.
-
Tap “Save” and publish the page.
Result: The metrics of the selected page or space are displayed as a macro.
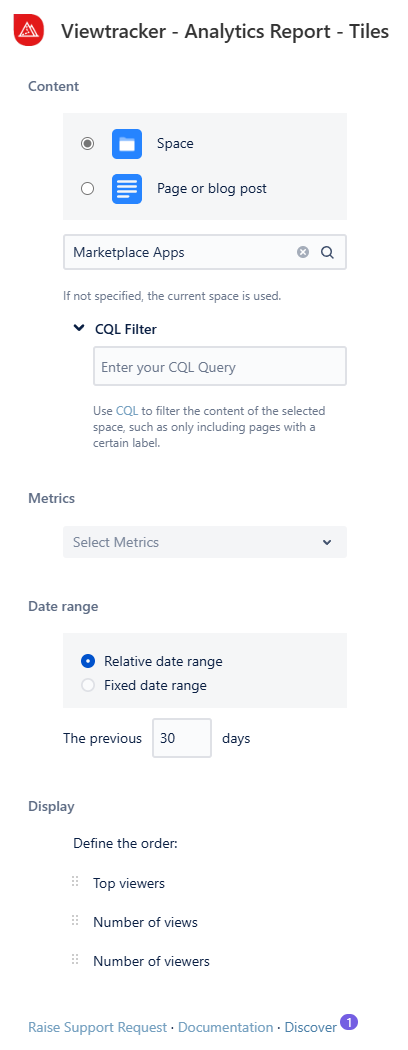
The general settings of this option
-
Content - You can filter for a space, a page, or a blog post.
-
CQL Filter - Use Confluence Query Language (CQL) to customize your report by applying specific filters.
-
-
Metrics - These are the same as those in the Viewtracker Reports (see the expansion below).
-
Date Range - Two types of date ranges can be set:
-
Relative: The default setting. It will continually update itself to the previous day.
-
Fixed: You can manually specify the start and end date of the report.
-
-
Display - Change the order of the tiles by dragging and dropping the existing Metrics.
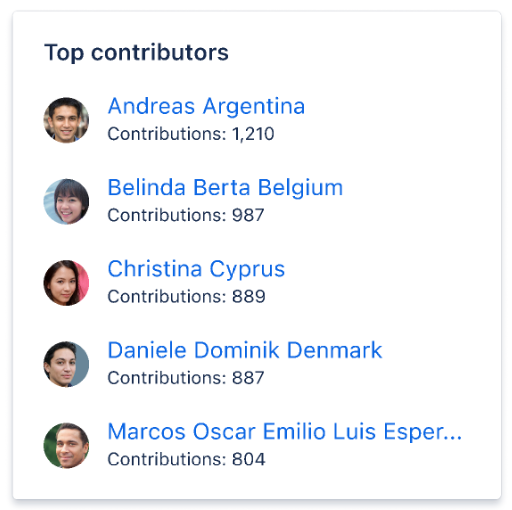
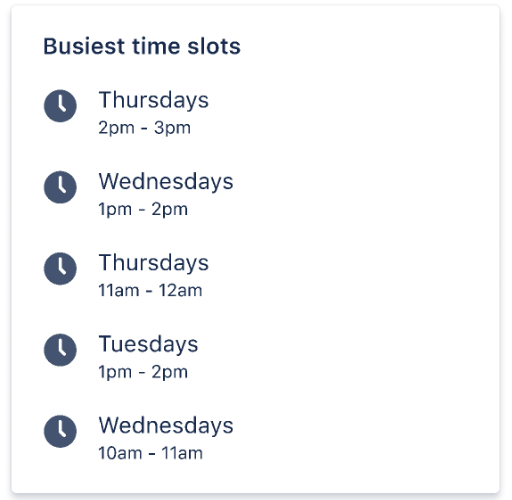
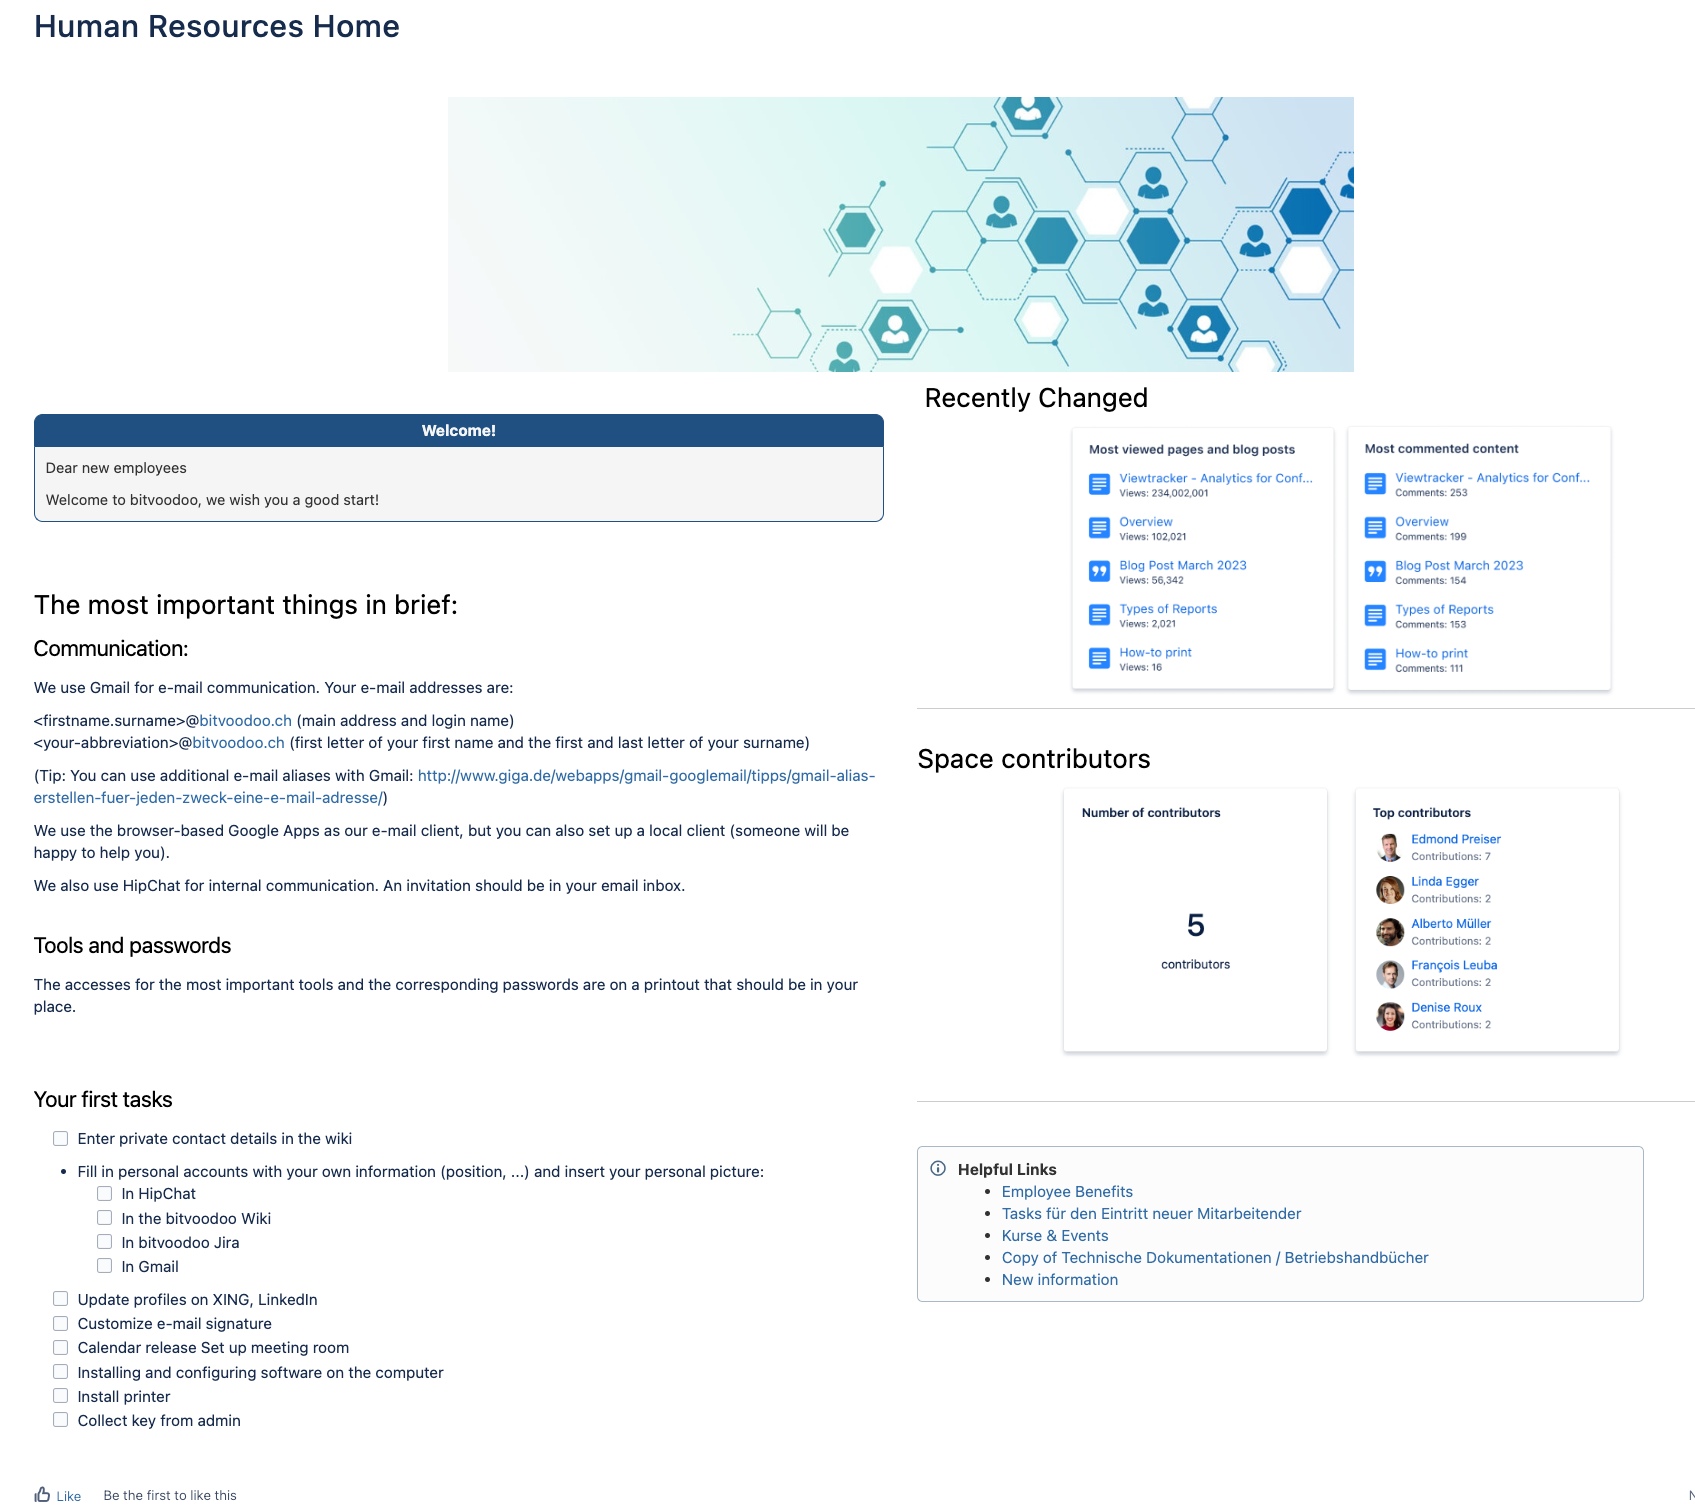
Examples of tiles
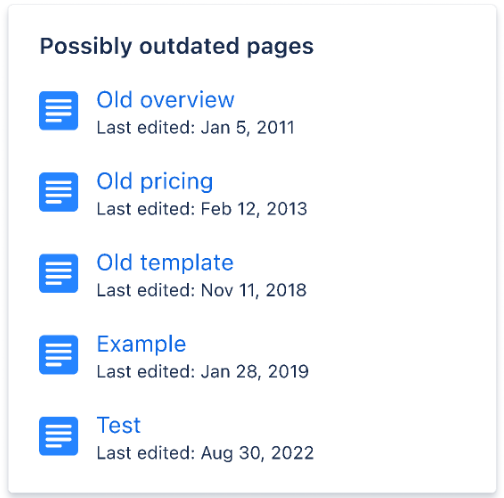
Examples Use Cases
Example use case 1: Personalized Landing Hub
Would you like to personalize a landing hub for each team and display all the latest news and discussions around their content?
With the tiles option, you can create eye-catching tiles to display specific information about the current space.
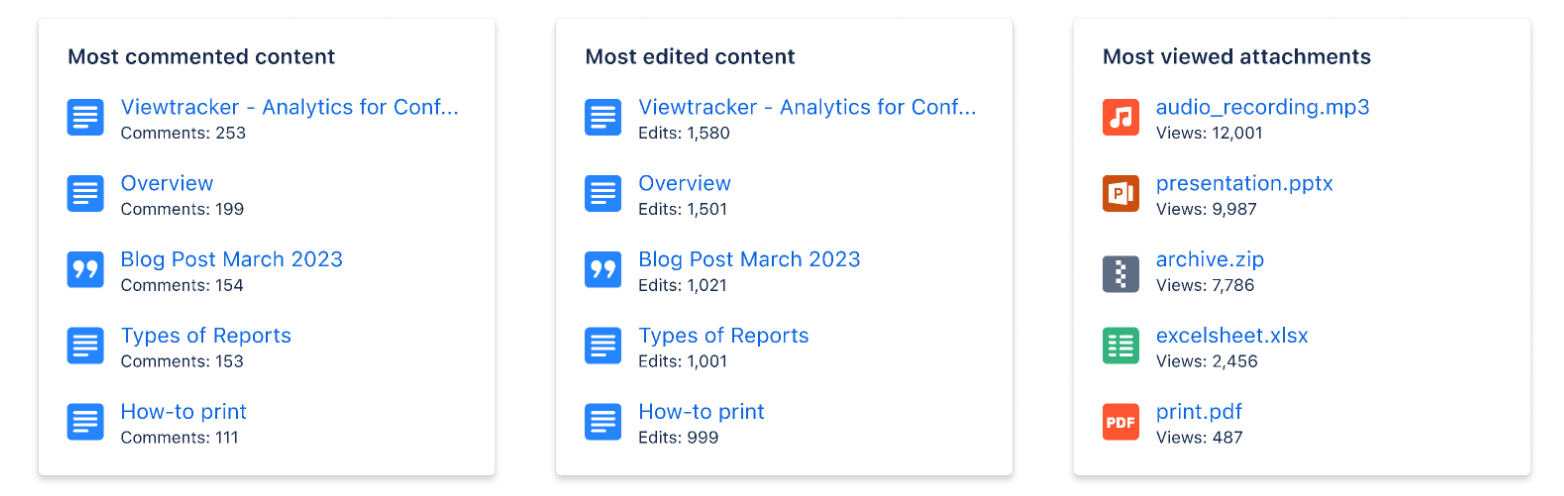
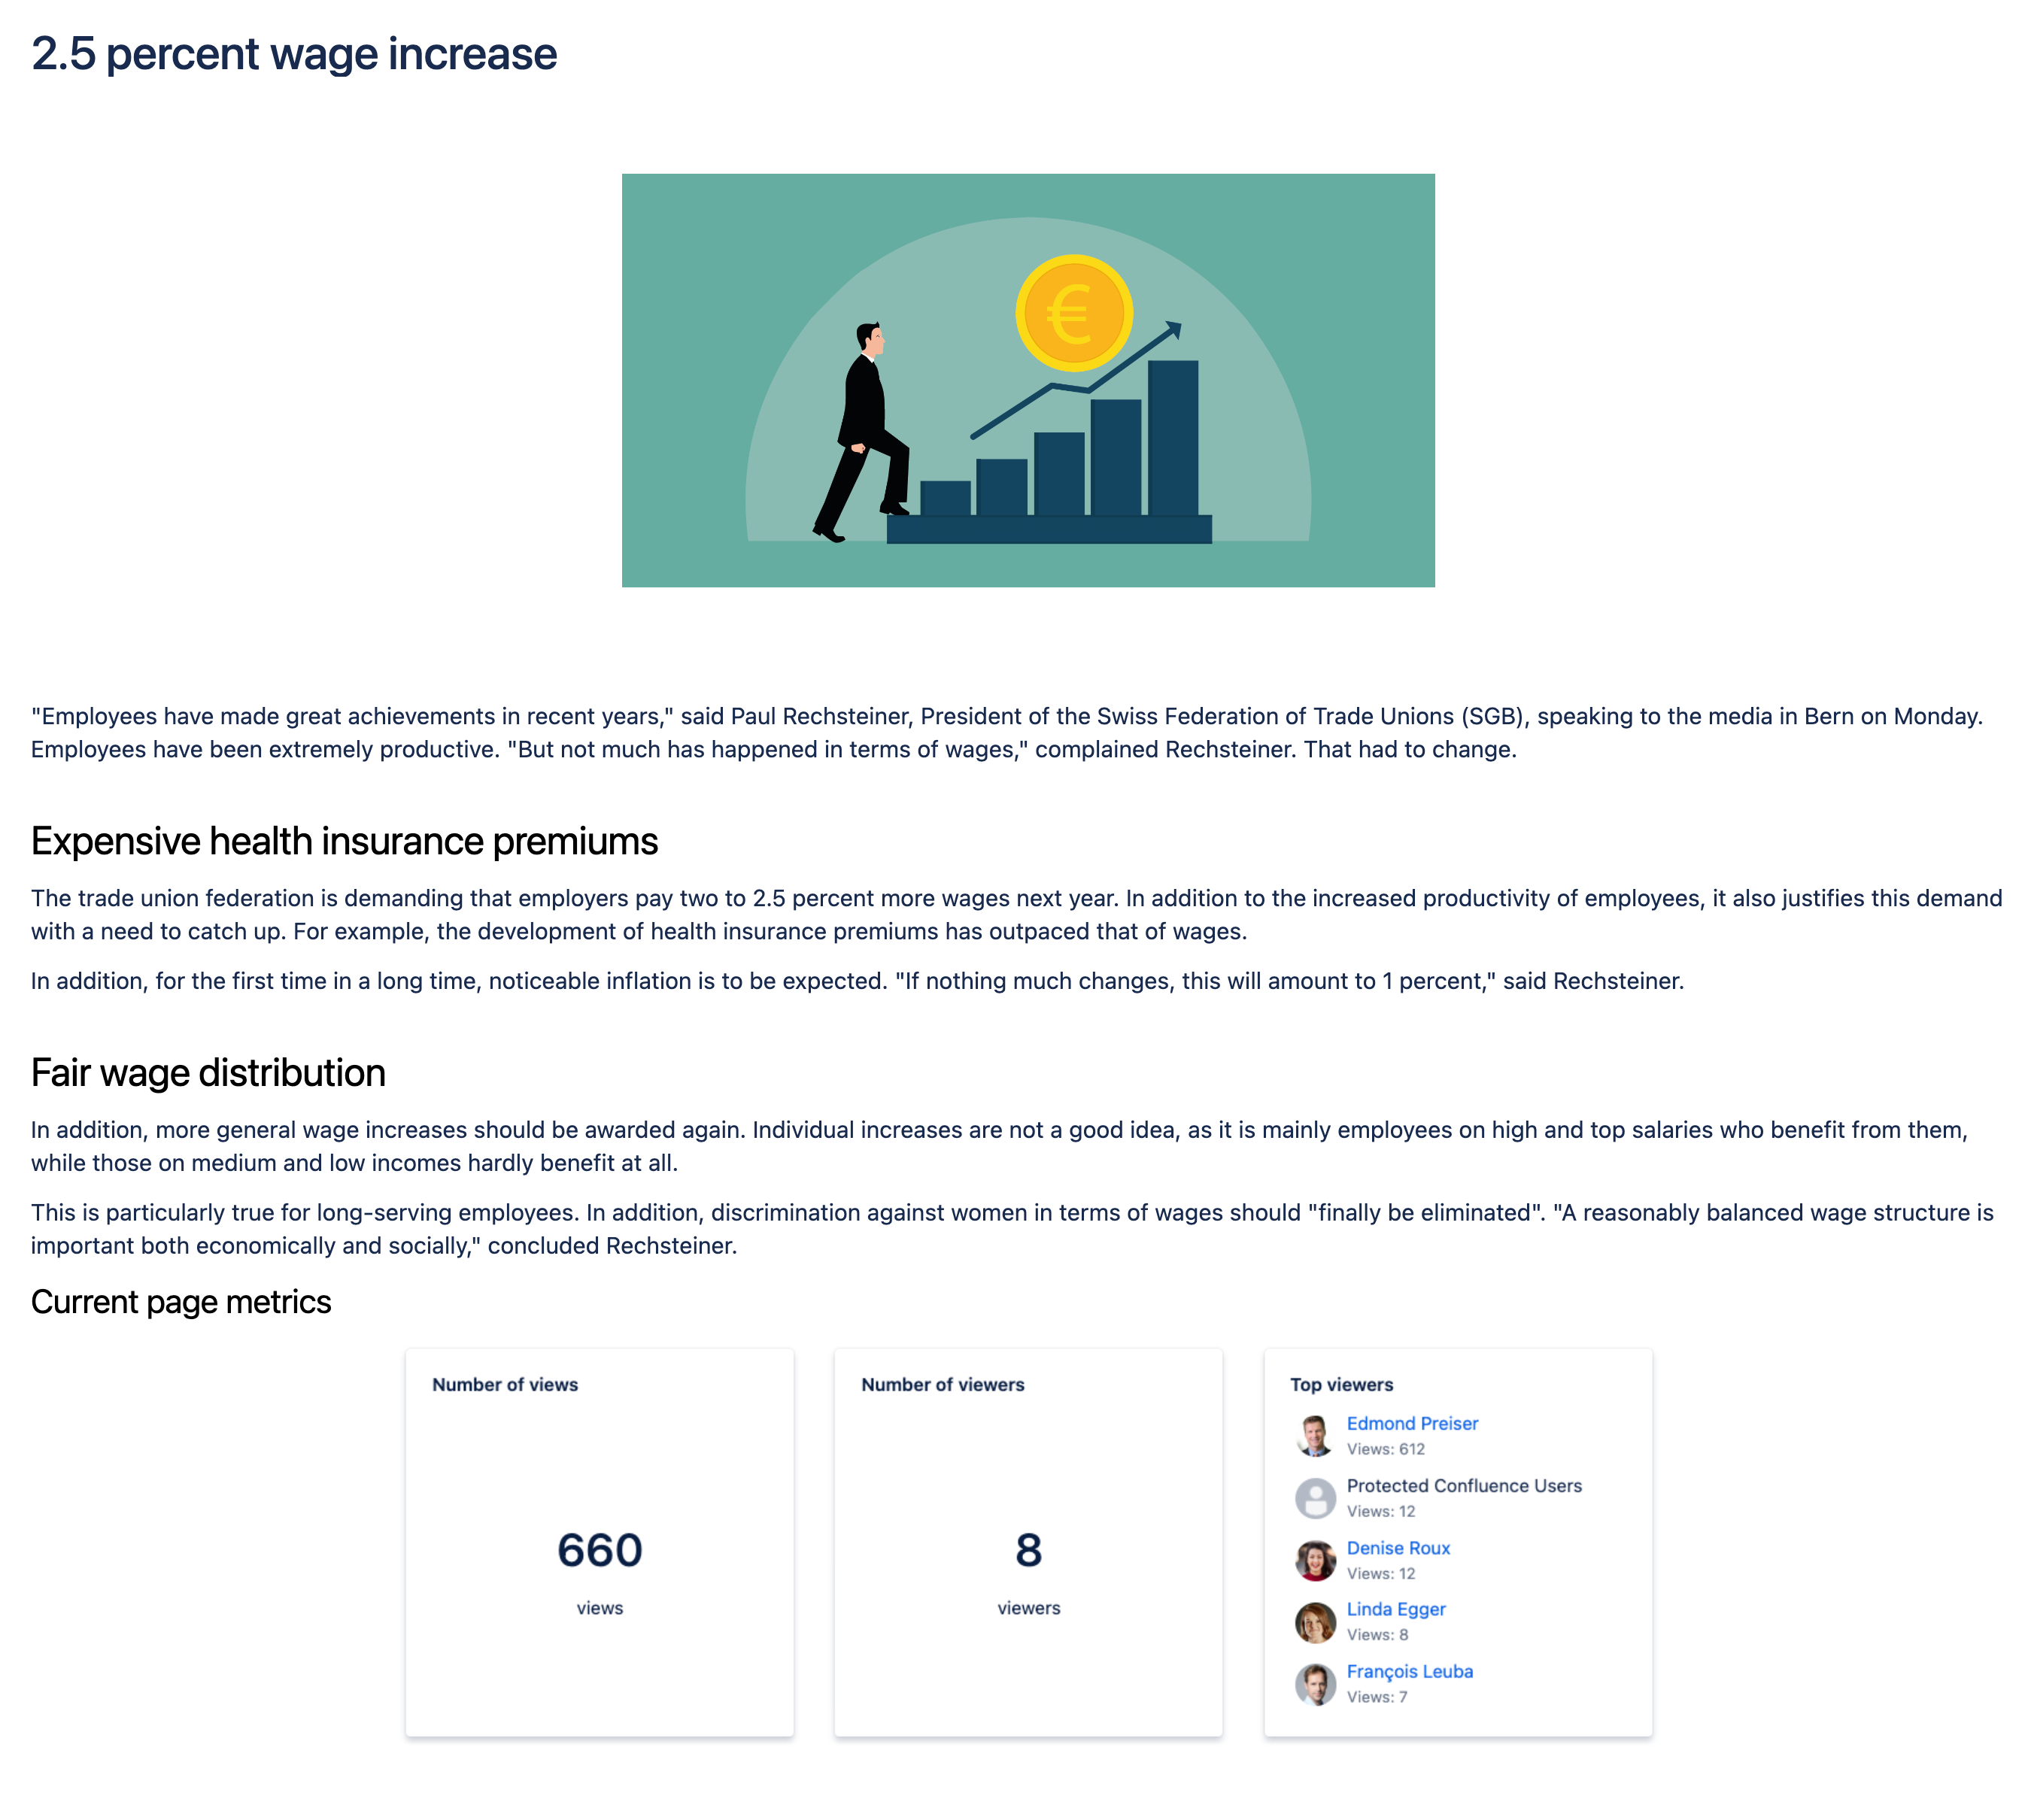
Use case 2: Displaying the metrics surrounding important news
Do you need to release important news? Enrich them with relevant lists or key figures.
List relevant content or user lists in tiles on specific topics and news.
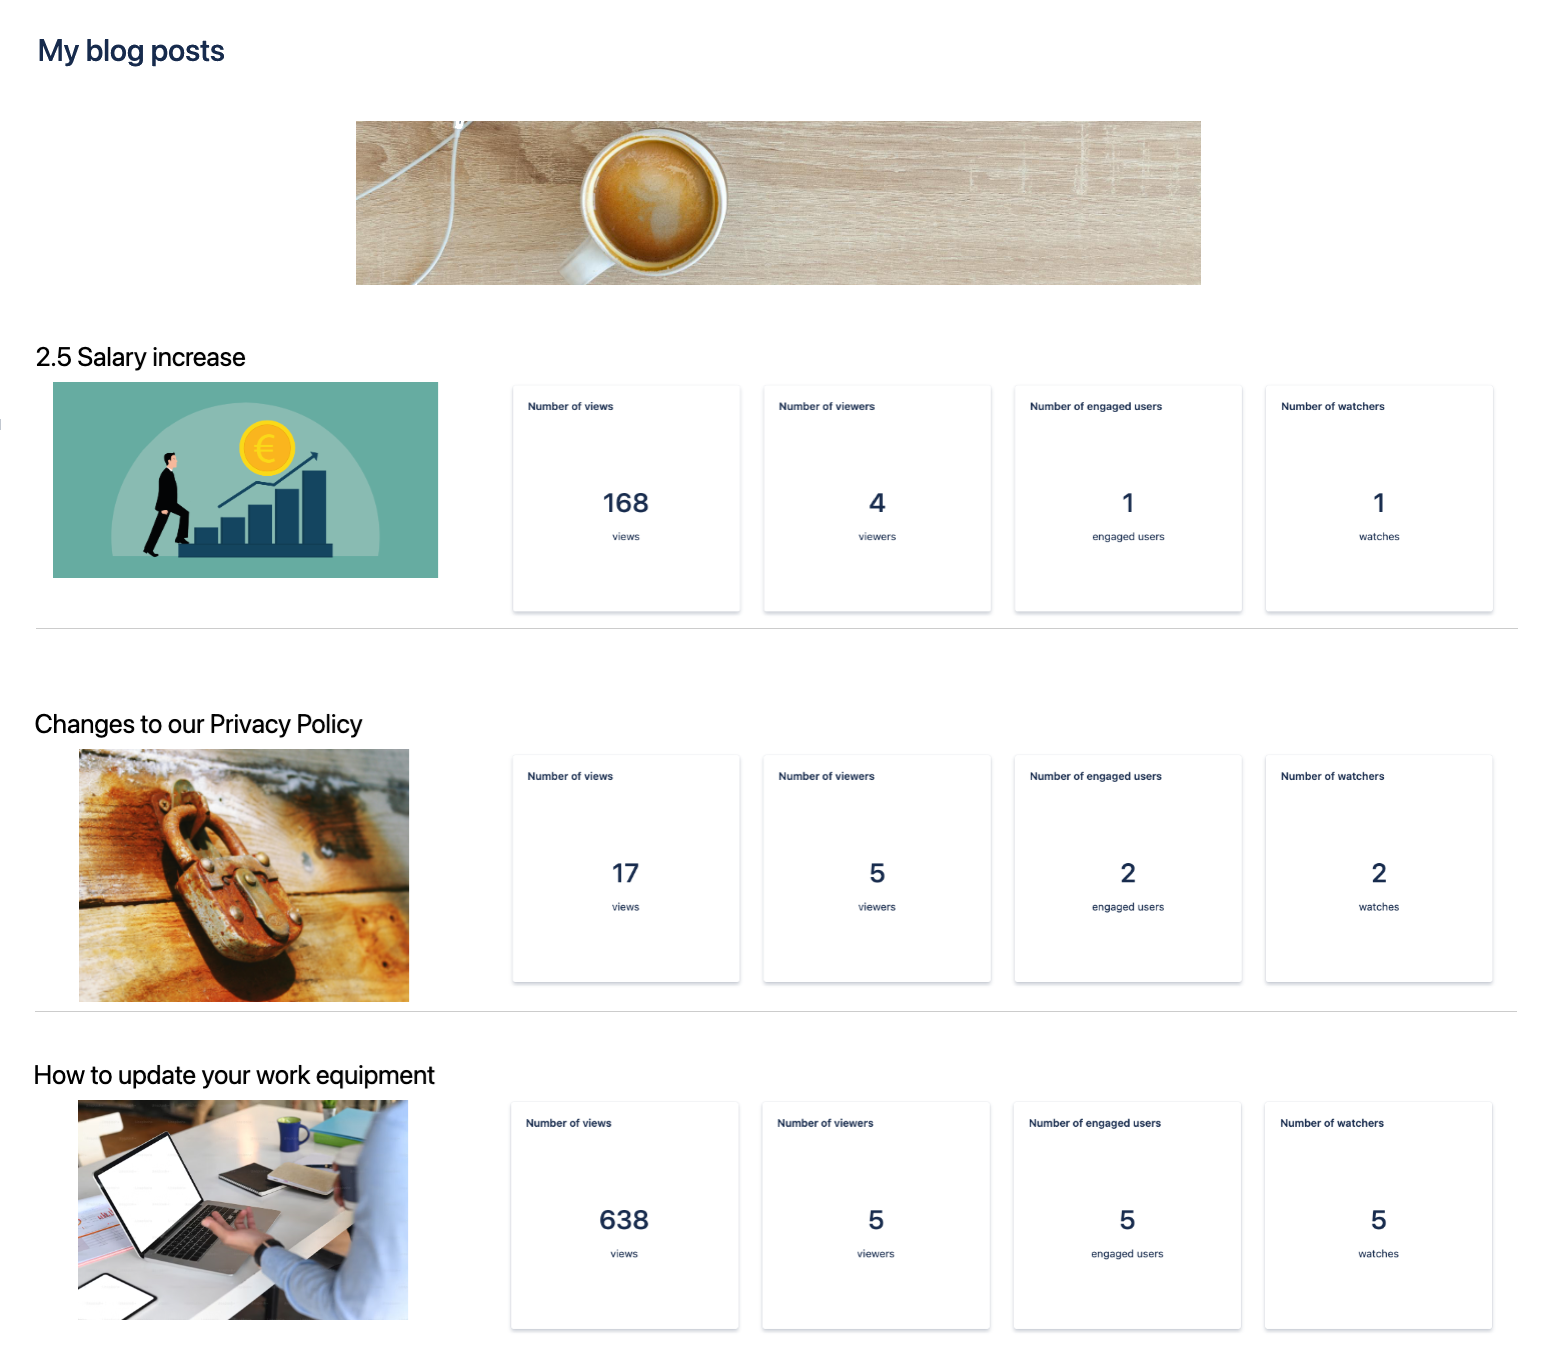
Use case 3: Compare the performance of different blog posts or news
Do you want to compare the performance of the most important blog posts for the same duration from the publication date?
Place a macro for each blog post and its desired key figures and set the respective time window since its publication.