|
Report Type
|
What the report can do
|
How to access the report
|
|
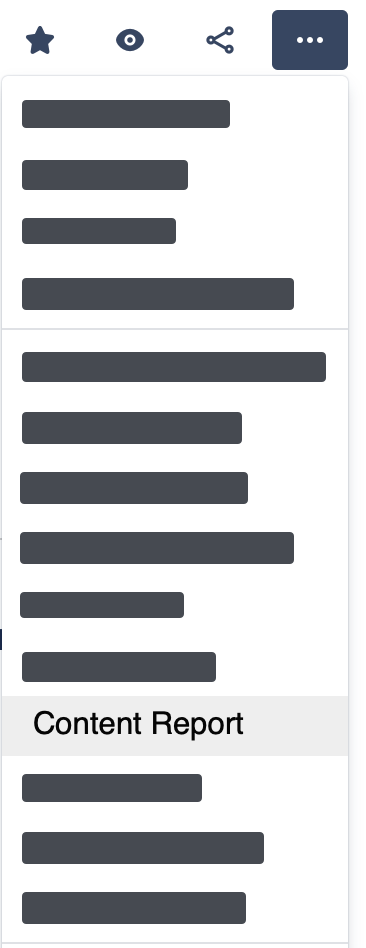
Content Report
|
-
See the total number of views a page or blog post attracted in the page's header.
-
Analyze the average time users (logged-in Confluence users, anonymous visitors, and readers of the Jira Service Management knowledge base) spent viewing or interacting with this page. See Tracking Settings.
-
Select different date ranges and observe how the metrics and graph update accordingly.
-
Group the metrics in the graph by day (default), week, month, or year.
-
Use the breadcrumb in the header to switch between Content, Space and Global Report (depending on access permission).
-
In the "Viewers" tab, you can view who has viewed the page, the number of times they have viewed it, and the amount of time spent on it, depending on your privacy and time tracking settings.
-
In the tab “Attachments,” see the number of attachments and attachment views.
-
Export the page views, viewers list, content edits or attachments views.
|
|
|
Space Report
|
-
See this space's total number of views, likes, edits, etc.. Drill down the numbers by accessing the Content & Usage Report.
-
See the number of attachments of this space and their number of views.
-
Select different date ranges and see the metrics and graph adapt accordingly.
-
Group the metrics in the graph by days (default), weeks, months, or years. Change the graph style to Line, Bar and Area charts.
-
Grant a specific group access to the Space Report.
-
Filter the data by source (desktop, mobile, Jira Service Management etc.), content type (page, blog post), and login state.
-
Determine the most popular (most viewed) content in your space
-
Determine the most active users (with most visits) in your space (depending on the privacy settings).
-
Determine the average time users (logged-in Confluence users, anonymous visitors, and readers of the Jira Service Management knowledge base) spend viewing or interacting with Pages & Blog posts across your instance. See Tracking settings.
-
Export your data as a CSV file.
|
Space tools → Analytics Cockpit
|
|
Global Report
|
-
See all tracked data of your Confluence instance at one glance:
-
Page and attachment views, Content & Usage, searches, creations, comments, etc.
-
Filter the data by spaces, source (devices, Confluence app, Jira Service Management, etc.), content type (page, blog post), login state and space type (standard or private).
-
Select different date ranges and see the metrics and graph adapt.
-
Group the metrics in the graph by days (default), weeks, months, or years and display them as a Line (default), Area, or Bar chart.
-
Filter the data with the additional CQL filter.
-
Determine your instance's most viewed content and spaces (Top Content, Top Spaces).
-
Determine the most active users (with the most views) in your instance (depending on your privacy settings).
-
Identify the average time users (logged-in Confluence users, anonymous visitors, and readers of the Jira Service Management knowledge base) spent viewing or interacting with pages & blog posts across your instance. See Tracking settings for more details.
-
Grant a specific group access to the Global Report.
-
Export your data as a CSV file
|
|
|
Content & Usage Report
|
List all users in your Confluence instance and their actions in a specified date range.List all content in your Confluence instance and how much it is used in a specified date range. Carry out quick actions, like deleting a page, directly in the report.List all spaces in your Confluence instance and how active they are in a specified date range. Access different space tools, archive, or delete spaces directly from the report. |
|
|
Attachment Report
|
Viewtracker measures attachment views and displays this information in various places throughout your Confluence instance. You can promote relevant content & remove unused attachments. |
|
|
Search Report
|
Search intent, uncovered for admins: Discover what your users are searching for in Confluence. |
|
|
Confluence URL Reports
|
Track components of your Confluence (including those generated by other apps) |
|
|
Instance Report
|
Discover how your Confluence instance is developing (includes user count, attachment storage, etc.) |
|
|
Space Status Report
|
Discover how your Confluence Space is developing.
|
|


