
This new report provides more metrics of the overall performance of your Confluence instance and gives you powerful filters to customize your reports.
-
📖 Read possible use cases for this report in our blog post on bitvoodoo.app.
-
Content & Usage Report: Spaces Track space performance in Confluence Data Center with Viewtracker's comprehensive Content & Usage Report for Spaces, offering tailored insights and metrics.
-
Content & Usage Report: Content Guide on using Content & Usage Report in Viewtracker for detailed analysis of content usage in Confluence, including views, edits, and engagement metrics.
-
Content & Usage Report: Users Dive into user-specific analytics with Viewtracker's Content & Usage Report for Confluence Data Center, detailing views, edits, and interactions by users.
Accessing the Content & Usage Report
This new report is part of the Global Report and the Space Report. It has a Global version (which shows information instance-wide) and a Space version (which displays metrics only for one space).
It can be accessed as follows:
Access the global report via:
-
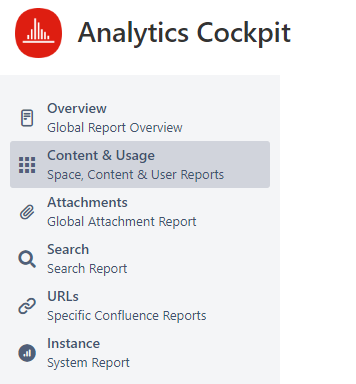
⚙ → Analytics Cockpit (visible to Confluence Administrators only) or
-
Confluence header → Analytics Cockpit (visible to users who have been granted access)
Then, select “Content & Usage” below the pre-selected “Overview.”
Access the report on a Space level:
-
Access a specific space.
-
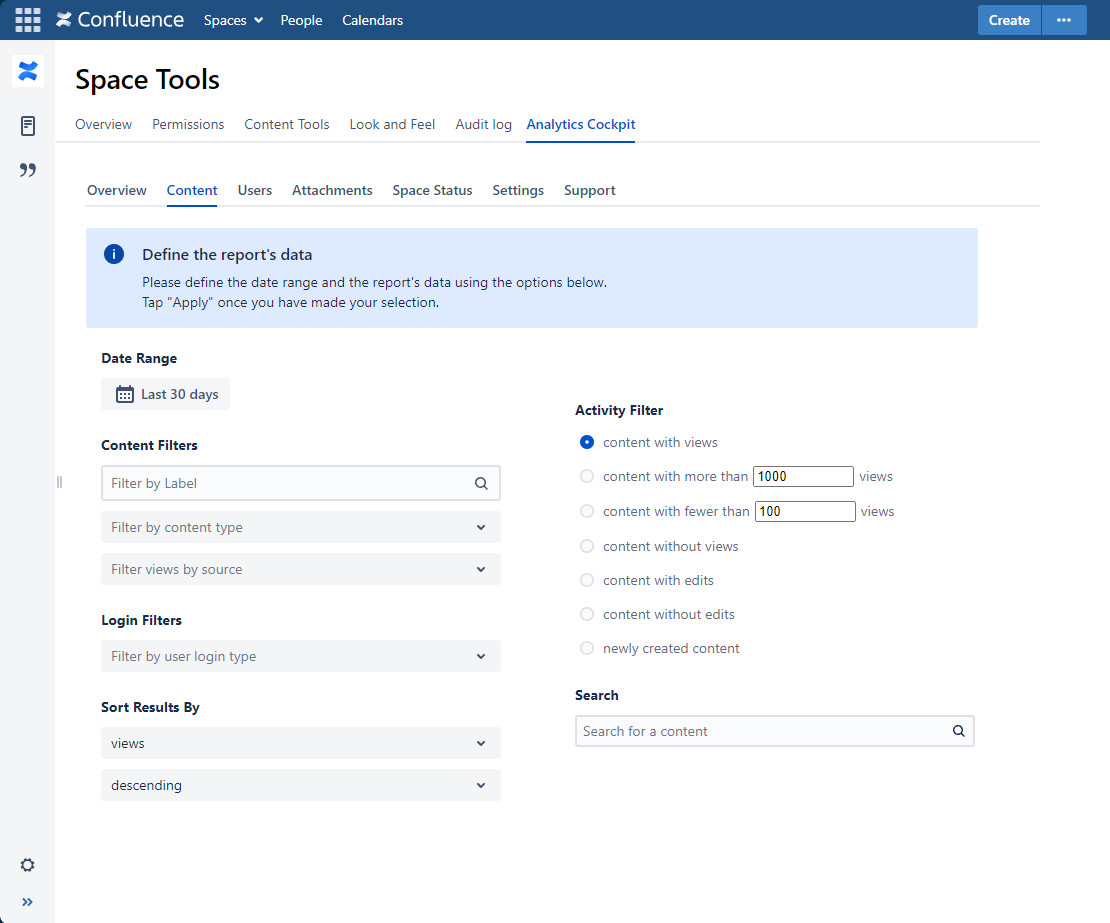
Select ⚙ Space tools → Analytics Cockpit
-
Choose either “Content” or “Users”:
The metrics on the Global and the Space levels are the same and are explained on these pages:
Disabling or limiting the Content & Usage Report
The number of Content & Usage reports that can be generated simultaneously is limited. Depending on the capacity of your Confluence instance, an administrator can change this number.
-
You can find more about this in the Administrator's Guide.